mirror of
https://github.com/XuehaiPan/nvitop.git
synced 2026-06-30 06:12:09 -06:00
[GH-ISSUE #58] [Feature Request] Show the real memory usage instead of just show the percentage #34
Labels
No labels
api
bug
bug
cli / tui
dependencies
documentation
documentation
documentation
duplicate
enhancement
exporter
invalid
pull-request
pynvml
question
question
upstream
wontfix
No milestone
No project
No assignees
1 participant
Notifications
Due date
No due date set.
Dependencies
No dependencies set.
Reference: github-starred/nvitop#34
Loading…
Add table
Add a link
Reference in a new issue
No description provided.
Delete branch "%!s()"
Deleting a branch is permanent. Although the deleted branch may continue to exist for a short time before it actually gets removed, it CANNOT be undone in most cases. Continue?
Originally created by @fuzihaofzh on GitHub (Mar 15, 2023).
Original GitHub issue: https://github.com/XuehaiPan/nvitop/issues/58
Originally assigned to: @XuehaiPan on GitHub.
Required prerequisites
Motivation
Thanks for this tool. For the memory panel, I can only see the percentage. Is it possible to show the real memory size together?
Thanks
Solution
No response
Alternatives
No response
Additional context
No response
@XuehaiPan commented on GitHub (Mar 15, 2023):
Hi @fuzihaofzh, have you ever tried the metrics screen? Select a process and press
Enter/Returnkey. Also you can press thetkey to switch to the treeview screen. Let me know if this resolves your concern.@fuzihaofzh commented on GitHub (Mar 15, 2023):
Sorry for not make it clear. I mean this memory for the machine

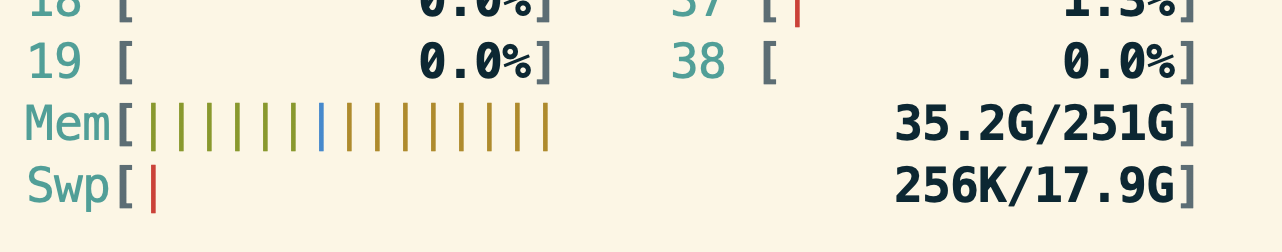
I want to see the total memory of current machine (e.g. 35.4G/251G). Maybe make it looks like htop style as follows?
@XuehaiPan commented on GitHub (Mar 15, 2023):
This is not compatible with the bar charts in
nvitop.nvitopuses box drawing characters, whilehtopis using|and colors. It's hard to render texts property when your host memory is almost full. Maybe you can use a terminal multipler liketmux.@fuzihaofzh commented on GitHub (Mar 15, 2023):
Thanks for the comments. I mean, as it can already show the percentage 10.4% in the above figure. It will not be quite hard to add some extra info (35.4G/251G). Or make it a possible option by users? It would be quite cool if I could see the total memory and the memory engaged in my machine. Thanks.